Watch Desk
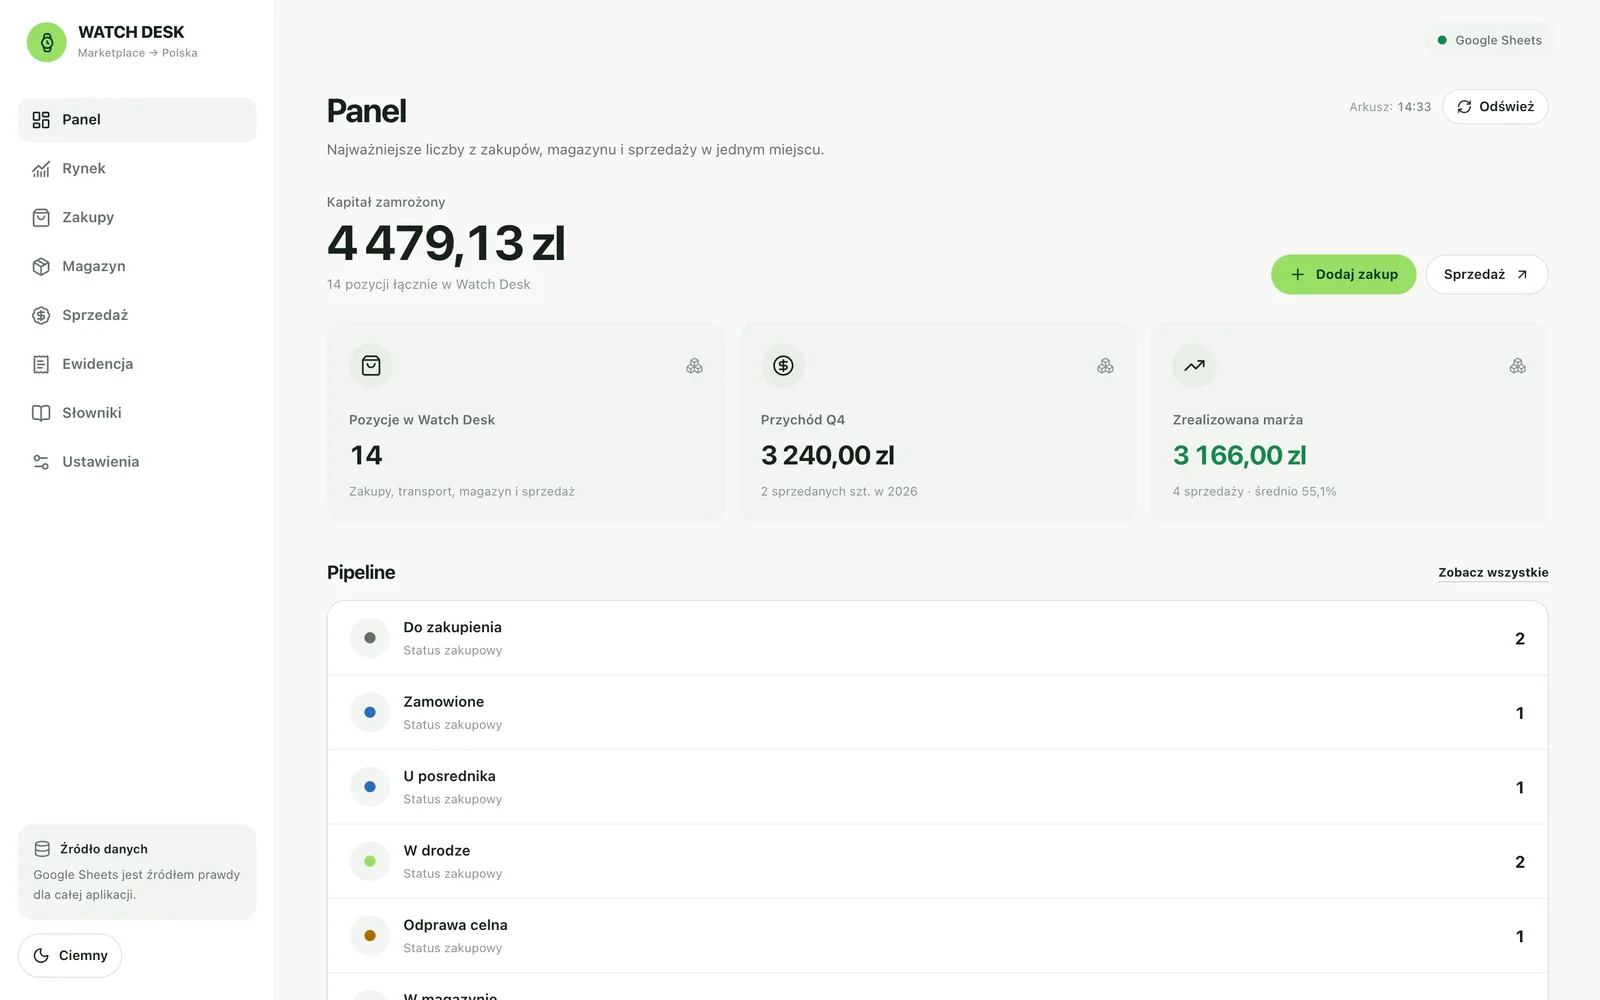
Watch Desk follows a watch from the moment a model looks worth buying to the booked sale. Watches are bought on a foreign marketplace and resold on Polish platforms. Everything sits in one Google Sheet, used by a web app, a REST API and an MCP server for an AI assistant.
Project facts
- Role
- Product design and full-stack implementation.
- Timeline
- September–November 2026 · in development
- Team
- Solo project · private business tool
How it works
One watch, start to finish
- MarketA model with demand evidence and a purchase price limit
- PurchaseAn offer from a foreign marketplace lands on the Kanban
- TransitForwarder, shipping and customs, with cost split per watch
- StockSerial number, cost with duty and VAT, location
- SaleMargin after fees and shipping on a Polish platform
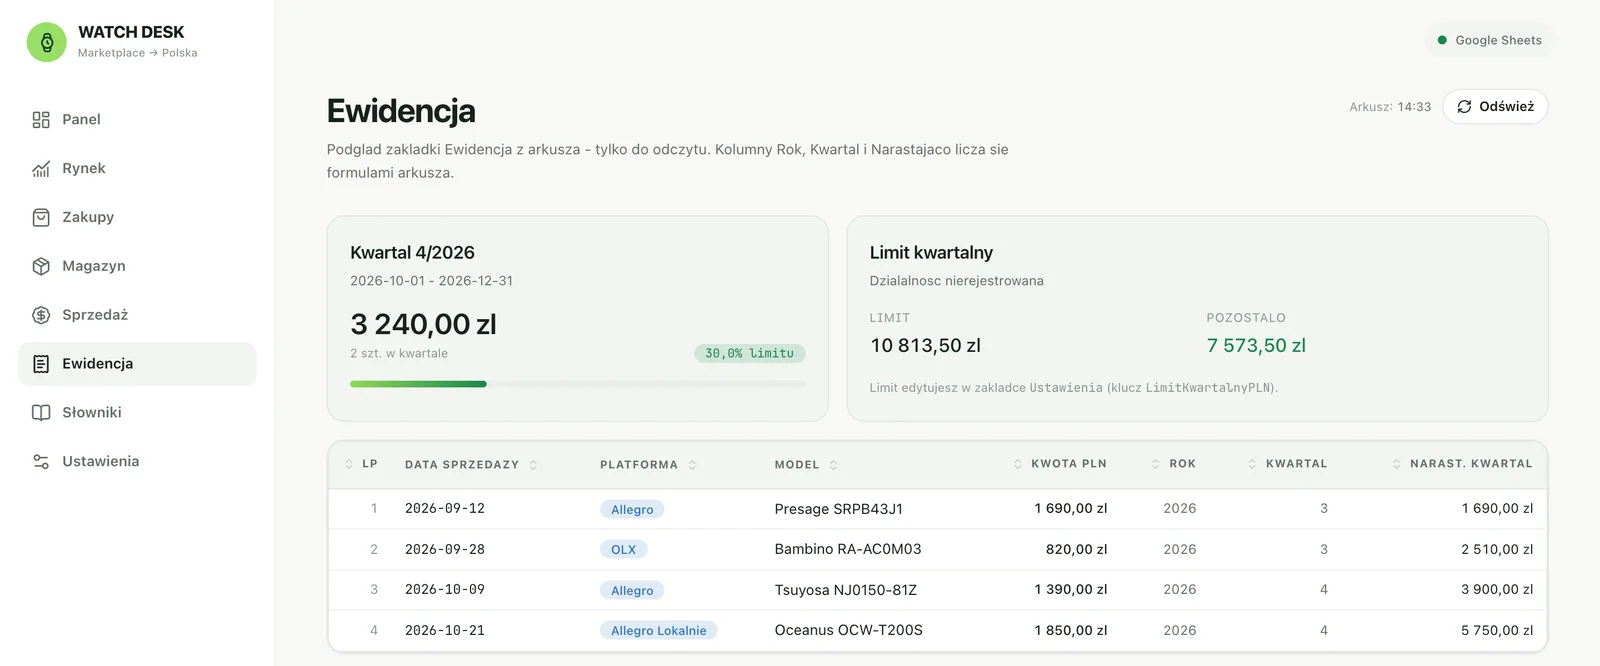
- LedgerQuarterly revenue and the limit check
Every step is written to the same Google Sheet. The dashboard, the API and the AI assistant all see the same data.
Problem
In watch trading, money is made or lost at the buying stage. You need to know which models actually sell and for how much. Then you have to track every piece through the order, the forwarder, shipping and customs. On top of that come shipping costs split across several watches, platform fees and a quarterly revenue limit for unregistered business activity. Across several separate spreadsheets, these numbers drift apart.
Key decision
Keep the Google Sheet as the single source of truth, because it can always be opened and checked by hand. The app, the API and MCP all go through the same domain rules, so neither a form nor the AI assistant can write data in a way that skips them.
How I built it
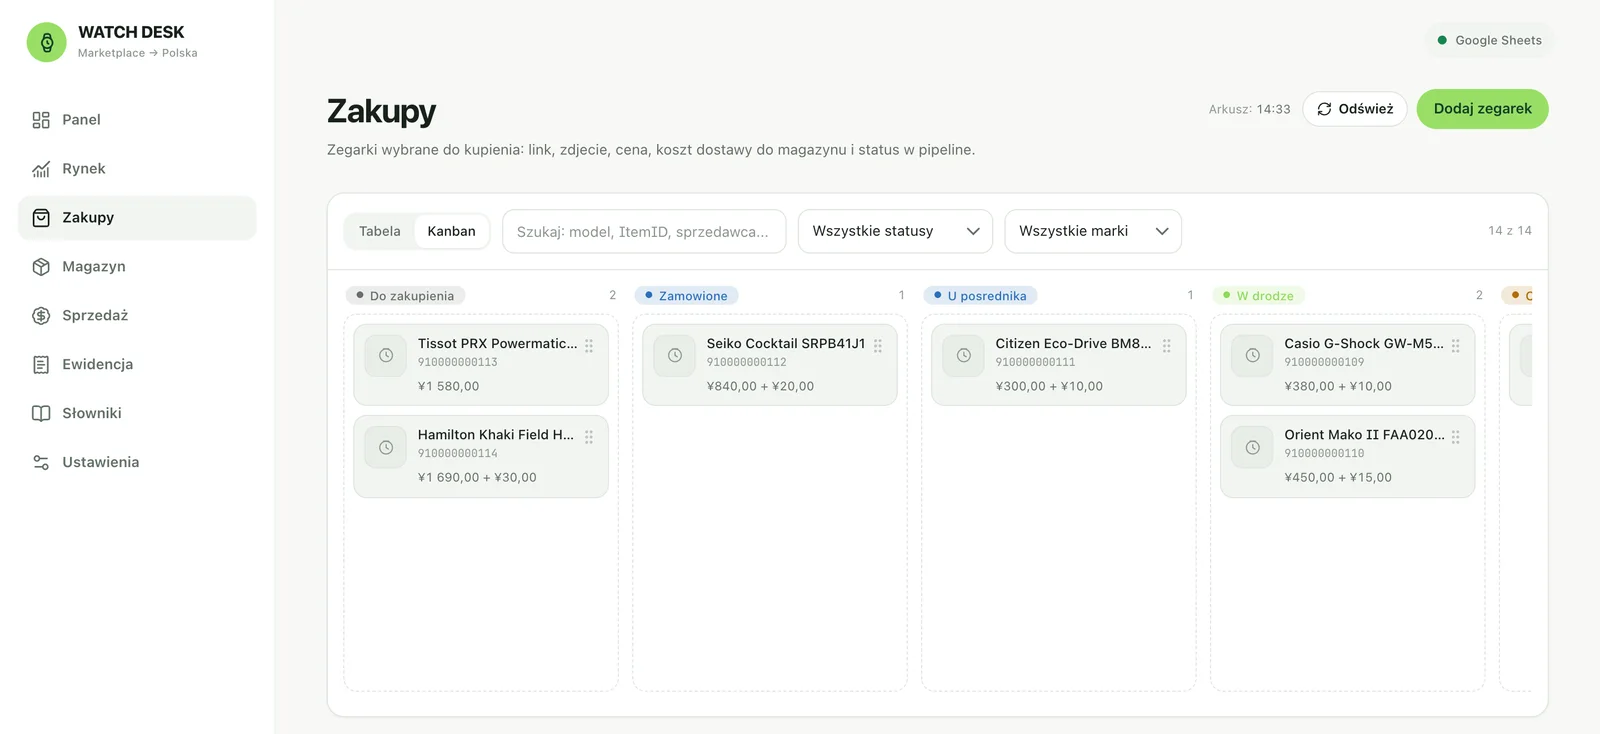
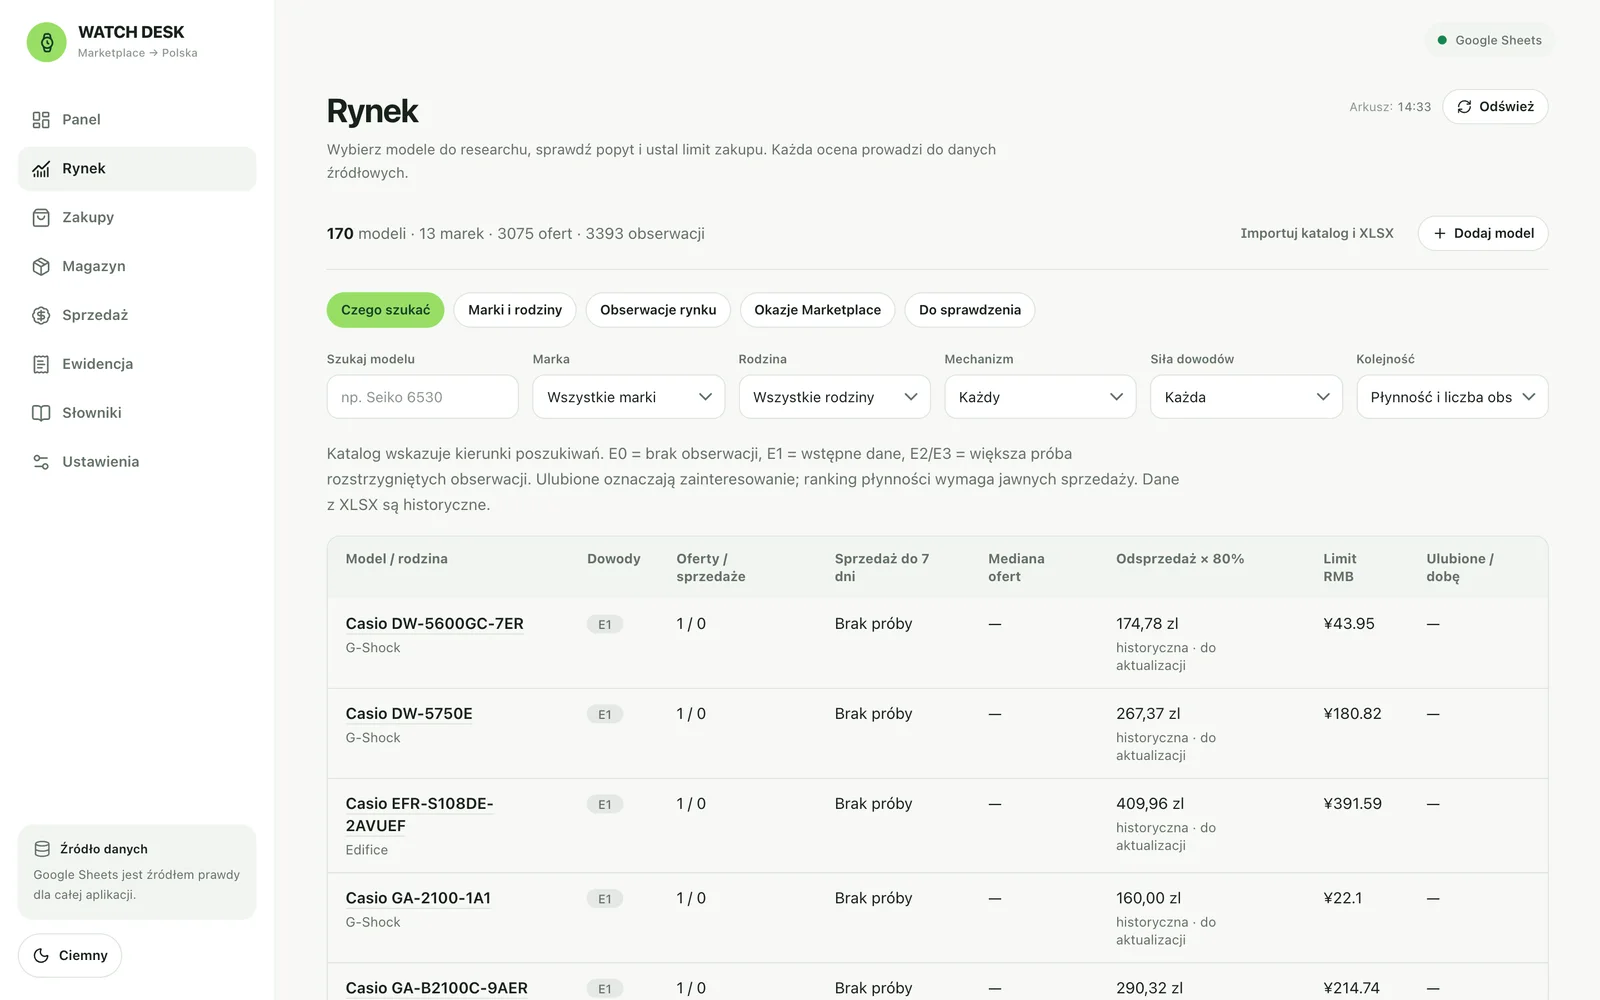
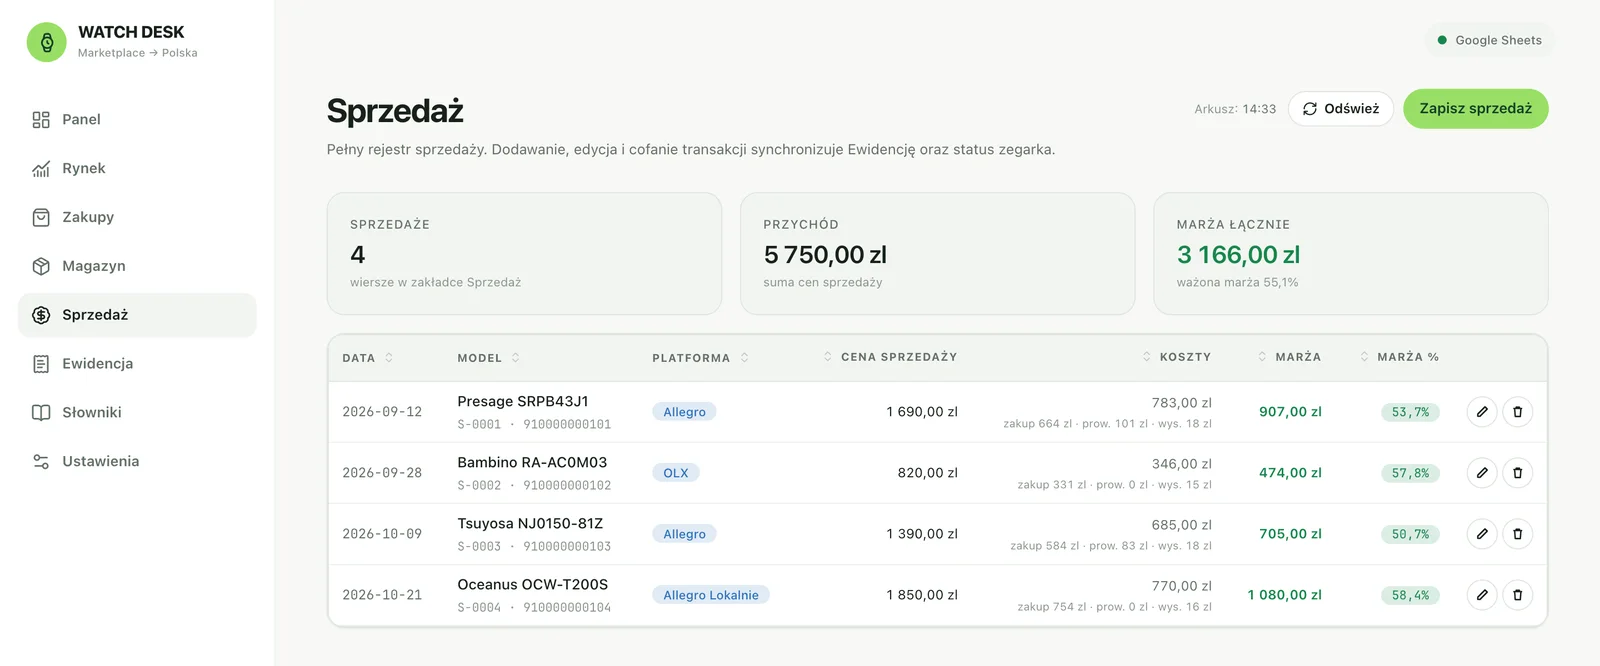
The Market module holds a catalogue of 170 models from 13 brands, plus observed offers from the Polish market. For each model it calculates evidence strength, median price, sales within 7 days and a maximum purchase price. A daily monitor checks tracked offers at a limited request rate. Purchases move through 8 statuses on a drag-and-drop Kanban board. Shipping cost is split across watches from the actual parcel, and stock carries the full cost including duty and VAT. A sale calculates margin after fees and shipping and updates the quarterly ledger straight away. Undoing a sale returns the watch to stock.
Highlights
- Market research: 170 models, E0–E3 evidence strength and a purchase limit derived from resale prices.
- A daily monitor of tracked offers that marks a likely sale only when the evidence is strong.
- A purchase Kanban with 8 statuses. Dragging a card writes the change to the sheet.
- Real shipping cost split across the watches in one parcel.
- Margin after fees and shipping, a quarterly ledger and a revenue-limit check.
- An MCP server with 29 tools for working with records through an AI assistant.
Architecture
- Next.js 16, React 19 and TypeScript, with data validation in Zod.
- Google Sheets API through a service account. Margin and running-total formulas stay in the sheet.
- An MCP (Model Context Protocol) server that uses the same services as the REST API.
- Tests run against an in-memory Google Sheets implementation, including a full MCP cycle: purchase → stock → sale → undo.
Limitations
- A private product, shown through screenshots. The source code is not public.
- Screenshots use sample data, and the figures are not business results. Offer sources are not named.
Outcome
One sheet and one app answer questions that used to take several files: what is worth buying and at what price, where each watch is, how much capital is tied up, what the margin is, and how much of this quarter’s limit is left.
Screenshots